Win Rate in Trading: Why It Does Not Matter
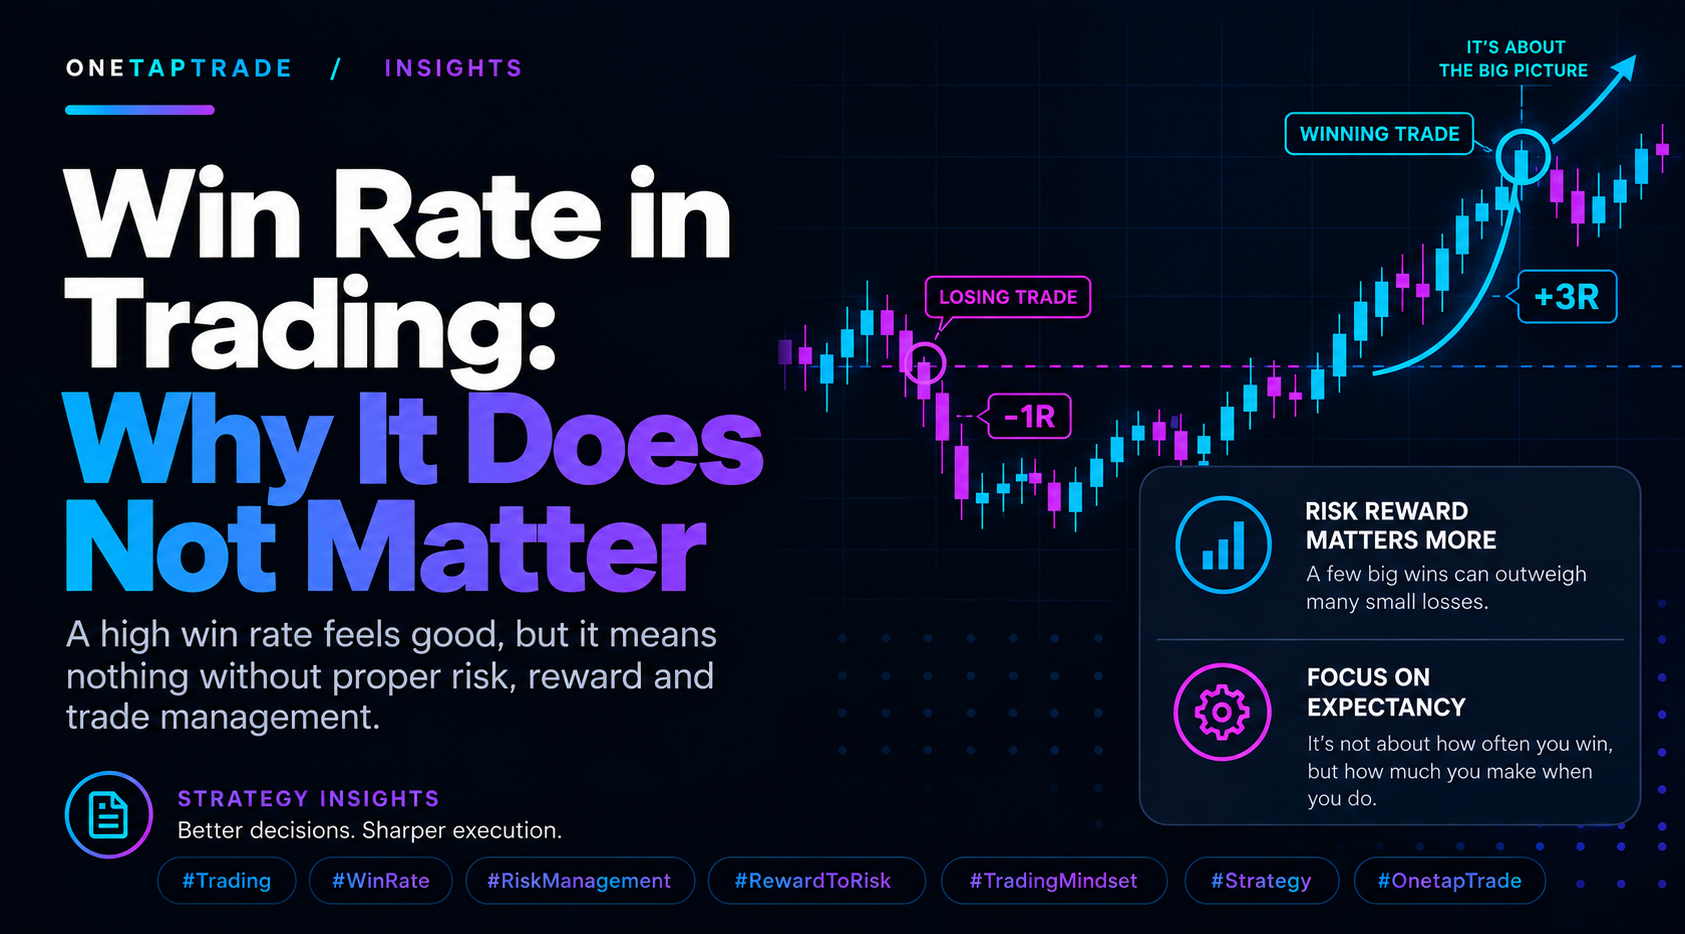
O N E T A P T R A D E / I N S I G H T S
and What to Track Instead
We ran two gold strategies over five years. The strategy that won 65% of its trades lost heavily.
The one that won 36% made money. This is the full story of why win rate misleads almost
everyone, and the two numbers that actually decide your results.
Risk Management Trading Metrics 12 Sep 2026 | OneTapTrade Research
Key takeaways
A high win rate does not mean a profitable strategy: our 65% win rate test lost 798R over 5 years while a 36% win rate strategy profited
Profitability is decided by the R equation: win rate multiplied by average win, minus loss rate multiplied by average loss
Measuring results in pips is misleading because volatility changes; gold's hourly range grew six times between 2021 and 2026
The three numbers worth tracking: average R per trade, profit factor, and consistency across years
Walk into any trading community and ask people how their system is doing. Nine out of ten will answer with a win rate. "I'm hitting 70%." It feels like the score of the game, the batting average, the report card. It is none of those things, and the fastest way to see why is to look at two real strategies we ran across the same five years of gold data.
HOW WE TESTED
Every number in this article comes from our own research engine: five years of minute-level price history (2021 to 2026) across nine markets including gold, EURUSD, USDJPY, GBPJPY, CADJPY and Bitcoin. Backtests fill at realistic prices, charge each market's real spread, commission and slippage on every trade, check the stop before the target inside every bar, and never read future data. Results are reported in R, where 1R is the amount risked on the trade, so that different markets and years can be compared honestly.
Can a high win rate strategy lose money? Here is the proof
Both of the strategies below traded gold. Both paid the same realistic costs on every trade: roughly 33 pips round trip for spread and slippage, which is what a retail account actually pays. Both were tested across the identical five-year window, through trending years and dead sideways years alike.
Win Strategy Timeframe Trades 5-year result rate
Mean reversion scalp (fade a stretch 5 minutes 15,753 65% Lost 798R from the mean, exit at the mean)
Wide channel breakout (buy 20-day 1 hour 273 55% Made +32R highs, trail the winner)
Positive in the whipsaw years Sweep reversal (fade failed breakouts) 1 hour 303 36% when everything else lost
Sit with the first row for a second. That strategy won almost two of every three trades, more than fifteen thousand times, and still destroyed the account. How?
The anatomy of the 65% loser
The scalp bought when price stretched below its short-term average and sold the return trip to the average. Most of the time that works: markets wiggle, and the wiggle back happens often. So the trade wins, and wins, and wins, each time collecting a sliver. The average winner was well under half of the amount risked. Then a real move arrives, the kind of move that does not wiggle back, and one trade gives back five winners at once. Then the round-trip cost, 33 pips on gold, takes its bite out of every single one of those 15,753 trades, winners and losers alike.
Do the arithmetic and the mystery dissolves. Winning 65% of the time while collecting small wins and paying full-size losses and per-trade costs is a losing formula that FEELS like a winning streak while it drains you. The win rate was never lying exactly. It was answering a question nobody should have asked.
What is R in trading, and why is it the honest unit?
One R is the amount you risked on a single trade: the distance from your entry to your stop loss, converted to money. Risk $100 per trade, and a trade that hits its stop is minus 1R, exactly $100 lost. A trade that runs to three times the stop distance is plus 3R, $300 made.
Once every trade is scored in R, the true equation of a trading system stops hiding:
Expectancy per trade = (win rate x average win in R) minus (loss rate x average loss in R) minus costs. That single line is the entire business. Win rate is one term among four. Move any of the other three terms and the same win rate produces wealth or ruin.
Worked example, both traders with a 60% win rate:
Trader A: wins average +0.5R, losses average 1R. Expectancy = 0.6 x 0.5 minus 0.4 x 1.0 = minus 0.10R per trade. Slow bleed, delivered with a smile.
Trader B: wins average +1.5R, losses average 1R. Expectancy = 0.6 x 1.5 minus 0.4 x 1.0 = plus 0.50R per trade. A serious edge.
Same win rate. Opposite lives. Nothing about a win rate, on its own, distinguishes A from B, and almost every retail dashboard shows the win rate in giant type while burying the numbers that matter.
The pips trap: why raw profit numbers rot over time
The second reason win-rate-and-pips reporting misleads is that pips themselves change value. Not against the dollar, but against the market's own movement.
Year Gold typical hourly range
2021 about 390 pips
2023 about 430 pips
2025 about 1,160 pips
2026 about 2,400 pips
Gold's hourly range grew roughly six times across our sample. A strategy that made 5,000 pips in 2021 and 15,000 pips in 2026 did not get three times better. Measured against the market's movement, it very possibly got worse. When we re-scored strategies in R, some of the biggest pip years turned out to be perfectly ordinary, and 2022, a monster pip year, was the worst year in the sample for nearly everything.
This is why every serious result in our research is stated in R. R survives regime change. Pips do not.
Why high win rates feel so good and end so badly
There is a psychological engine underneath this that deserves respect, because it catches intelligent people constantly.
A high win rate system pays you in the currency your brain loves: frequent, small, reliable rewards. Green day follows green day. You feel skillful. You add size. The system's true shape, many small wins funded by rare large losses, only shows itself occasionally, and when it does, it is easy to call the loss an anomaly, a news spike, bad luck. So the pattern continues until one clustered run of losses does the quarter's damage in a week. Trend systems invert every part of that experience. Our breakout strategy on gold was flat or losing most weeks. Genuine trends exist only a few percent of the time in any market we measured, so a trend system spends most of its life being wrong in small amounts, waiting. Then a 2024 or a 2025 arrives and a handful of trades pays for two years of patience. Traders abandon these systems constantly, not because the math fails, but because the experience is miserable exactly when the system is working as designed.
The rule that follows: if you judge a system inside a window shorter than its payoff cycle, you will keep the seductive losers and kill the uncomfortable winners. This is possibly the most expensive systematic error in retail trading.
What should you track instead of win rate?
- Average R per trade
The purest edge number. Across a few hundred trades, a durable average of even +0.10R per trade is a real business. Our structure-and-order-block system measured +0.098R per trade across five years: modest
looking, genuinely bankable. For contrast, the 65% win rate scalp measured minus 0.05R per trade, and no position sizing scheme in the world can turn a negative expectancy positive.
- Profit factor
Gross winnings divided by gross losses. It compresses win rate and payoff into one honest ratio. Below 1.0 the system loses. Between 1.0 and about 1.15 it is probably paying for your broker's office furniture and nothing else. Durably above about 1.2 after real costs, across years, it deserves respect. The best configurations in our five-year research measured between 1.2 and 1.5.
- Consistency across years
Split the record by year. A system that made +40R with all of it inside one lucky stretch is a coin that landed well. A system positive in five of six years, even at smaller totals, has demonstrated the thing you actually need: survival across regimes. When we improved a strategy this year, the change we kept was one that moved it from three positive years out of six to five out of six, even though the total profit barely moved.
A practical checklist for reading any strategy result
- Ignore the win rate on first pass. Look at average R per trade after costs.
- Ask what the average winner and average loser look like in R. A big gap in the wrong direction predicts
fragility.
- Check the yearly split. One golden year carrying five dead ones is a warning, not a track record.
- Ask how many trades the numbers rest on. Under about 100 trades, treat every statistic as provisional.
- Only then look at win rate, and only to understand the system's personality: high means many small
wins and hard drawdowns when wrong, low means long quiet stretches and occasional harvests. Neither is better. They are temperaments, not qualities.
Frequently asked questions
What is a good win rate for trading?
There is no good win rate in isolation. A 40% win rate with 2R average winners is excellent. A 75% win rate with 0.3R winners and 1R losers is a slow account leak. Judge the full R equation, never the win rate alone.
What is a good average R per trade?
After realistic costs, anything durably above +0.05 to +0.10R per trade across hundreds of trades is a genuine edge. Most published systems, tested honestly, measure at zero minus costs.
Is a 50% win rate good?
With winners larger than losers, 50% is comfortably profitable. With winners smaller than losers it is a guaranteed decline. The number 50 tells you nothing by itself.
Why do prop firms care about win rate structure?
Drawdown rules punish negative skew hard. One bad week of a high win rate, large loss system can breach a 5% daily loss limit that a low win rate, small loss system never approaches. Firms survive on traders whose losses are structurally capped.
Can position sizing fix a low expectancy?
No. Sizing scales an edge, it cannot create one. Sizing a negative expectancy system up simply loses faster, and this is provable arithmetic, not opinion.
Data: 5 years of bars, 9 markets, 2021 to 2026, measured on our backtesting OneTapTrade | The Unfair Advantage | engine onetaptrade.com