Trending vs Ranging Markets: Why Most
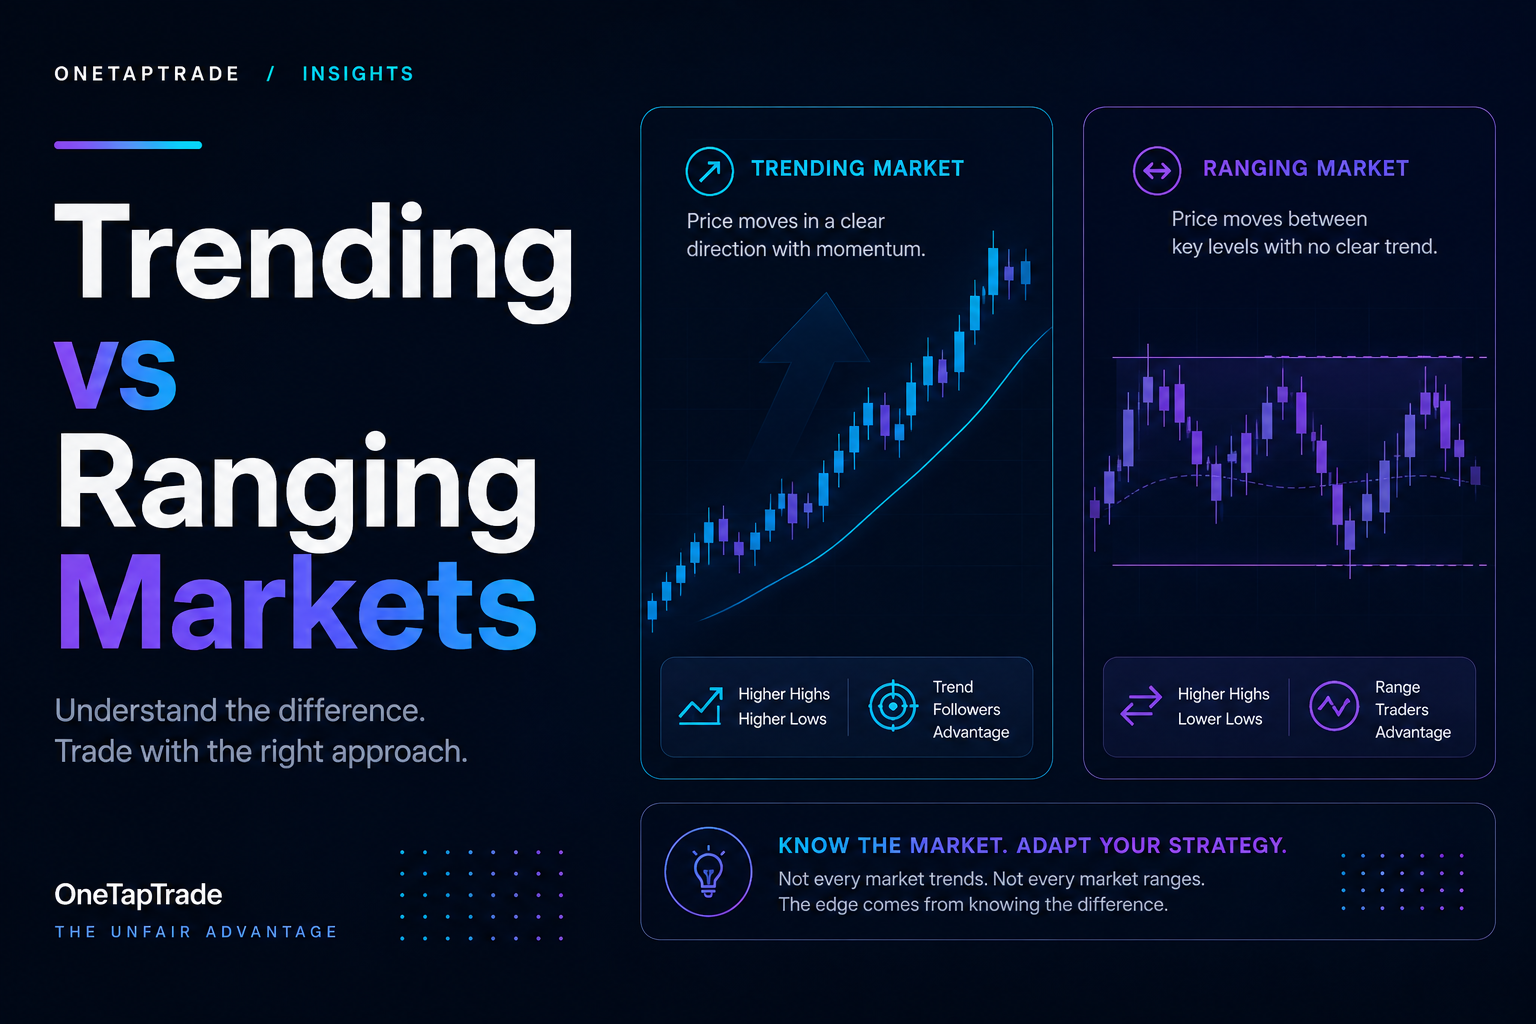
O N E T A P T R A D E / I N S I G H T S
Trading Bots Lose in the Wrong Regime
Most automated strategies do not fail because their rules are bad. They fail because the market changes character and the rules keep firing anyway. This guide shows you how to tell a trend from a range with simple indicators, and uses a real three- week gold case study to show exactly what happens when a bot trades the wrong regime.
Author: OneTapTrade Team · 24 Aug 2026 · 9 min read · Last updated: 24 Aug 2026
D I R E C T A N S W E R
A market regime is the prevailing character of price action: trending (price moves persistently in one direction) or ranging (price oscillates inside a band and keeps reverting to a mean). Almost every trading strategy has an edge in only one of the two. A mean-reversion system harvests ranges and bleeds in trends, while a breakout system does the opposite. The single most effective upgrade for most bots is not a better entry, it is a regime filter that switches the strategy off when the market stops suiting it.
What Is a Market Regime?
A regime is the type of market you are in, not the direction of the last candle. Two clean archetypes cover most of what matters:
Ranging (mean-reverting). Price trades inside a band. Pushes to the edges get sold or bought back toward the middle. Stretched prices snap back.
Trending (momentum). Price makes sustained higher highs or lower lows. Stretched prices keep stretching. Pullbacks are shallow and get bought or sold in the direction of the move.
The same signal means opposite things in the two regimes. "Price is far above its average" is a sell signal in a range and a strength signal in a trend. That is why a strategy cannot be judged without asking which market it was tested in.
Why Do Range Strategies Lose So Badly in Trends?
Because of payoff asymmetry, not signal accuracy. A typical fade strategy takes small profits when price reverts and a larger loss when it does not. Suppose the average winner is $15 and the average loser is $30. The break-even win rate is 66.7%. In a range the strategy might win 70% of the time and grind out profit. In a trend the win rate slips to 59%, which still sounds respectable, and the account bleeds steadily.
Worse, a trend manufactures more signals. Every session in a strong rally looks "overbought" to a fade system, so the bot trades more often at exactly the moment its edge is weakest. Losing more per trade, more often, on more trades. That is the whole mechanism.
A Real Case Study: One Gold Bot, Two Regimes
The numbers below come from a live forward test of a mean-reversion gold (XAUUSD) system run on demo through late July and August 2026, a period that conveniently contained both regimes back to back.
Phase 1: the range (29 Jul to 4 Aug). Gold traded a $100 band, roughly 4,008 to 4,108, for a full week. Every push reverted. The bot took 92 trades at a 66% win rate and made +$500.
Phase 2: the trend (10 Aug to 21 Aug). A weak US jobs report, a cool CPI print and a Treasury buyback announcement stacked into a one-way rally. Gold climbed 9.2% in twelve trading days. The bot kept fading it: 160 of its 186 trades were sells into the rising market. Result: -$622, giving back the entire range-phase profit and more.
The sell trades in the trend phase still won 59% of the time. The average winner was $14.54. The average loser was $30.48. The maths never had a chance.
RANGE PHASETREND PHASE 29 Jul - 4 Aug · +$50010 - 21 Aug · -$622
$0
29 Jul 8 Aug 21 Aug Same bot. Same rules. The only variable that changed was the regime.
Fig. 1 — Cumulative P&L of one mean-reversion gold bot across a range week and a trend fortnight, forward- tested on demo, Jul-Aug 2026.
Grouping every session by its net daily move makes the losing condition explicit:
SESSION TYPE SESSIONS TOTAL P&L WHAT THE BOT EXPERIENCED
3 +$347 Flat / rotational days Price rotated around a level, fades reverted
11 -$225 Trending up days Sell signals fired repeatedly, no reversion came
5 -$25 Trending down days Fast whipsaw sessions, stops hit both ways Results from a live demo forward test and are illustrative. They describe one strategy on one instrument over one period, not a general performance claim.
How Do You Tell a Trend From a Range?
You do not need anything exotic. Three simple, robust measurements cover the job, and all of them can be computed on any platform.
- ADX for trend strength
The Average Directional Index measures how directional price has been, regardless of direction. A practical reading for intraday gold: below 20 means range conditions, 20 to 25 is transition, above 25 means the market is trending. The slope matters as much as the level. ADX rising through 20 is a trend being born. ADX falling from 40 is a trend maturing.
- Distance from a long moving average, in ATR units
Compute (close minus EMA200) divided by ATR. A price one ATR from its long average is normal noise. A price that holds three or more ATRs above the average for many consecutive bars is a runaway trend, and fading it is a donation. This one number doubles as both a fade signal (small stretch) and a stand-down signal (large, sustained stretch).
- Higher-timeframe structure
On the 4-hour chart, is the market printing higher highs and higher lows? A rolling 50-bar high/low comparison encodes this in two lines of code. In the case study above, gold never printed a single lower low on the 4-hour chart during the trend phase. That one check would have blocked every losing sell.
SIGNAL RANGE READING TREND READING ACTION FOR A FADE BOT
ADX (14) < 20 > 25 Trade normally / stand down
Distance from EMA200 < 2 ATR > 3 ATR sustained Fade the stretch / do not fade
4h structure No new HH/LL Consecutive HH or LL Both sides / block counter-trend side
Threshold values are illustrative starting points for intraday gold and should be validated per instrument and timeframe.
What Should the Bot Do About It?
The wrong fix is adding more entry filters to each trade. Filters tuned after a losing streak usually clip the strategy’s winners along with its losers, and you end up with a worse system that trades less. We have measured this repeatedly across our own strategy library: tightening exits or stacking confirmations on a proven edge tends to destroy it.
The right fix operates one level up. Leave the edge alone and control when it is allowed to play:
- Gate, do not filter. A regime gate switches the whole strategy off (or blocks one side) when the
market is trending. The entries themselves stay untouched.
- Make the gate slow. Compute it on the 1-hour or 4-hour chart so it flips a handful of times per month,
not per day. A fast gate just becomes another noisy indicator.
- Respect the calendar. Regime breaks are usually caused by events. The August 2026 trend was
ignited by a payrolls shock and extended by a CPI print and a Treasury announcement. A blackout around red-calendar news is a regime control, not a superstition.
Where Does This Fit in Your Workflow?
Regime awareness belongs at every stage of the automation pipeline. When you create a strategy, decide explicitly which regime it monetises. When you backtest, check that the test window contains both regimes, because a range-only backtest of a fade system is flattery, not evidence. When you deploy, attach the gate. And when you monitor, watch the regime measurements alongside P&L, because the drawdown that matters usually starts the day the regime flips, not the day the equity curve finally shows it.
K E Y T A K E A W A Y S
A market regime is the character of price action: trending or ranging. Nearly every strategy has an edge in only one.
Fade strategies lose in trends through payoff asymmetry: a 59% win rate with $15 winners and $30 losers is a steady bleed.
Trends also generate more fade signals, so the bot trades most exactly when its edge is weakest.
In our forward test, one gold bot made +$500 in a one-week range and lost $622 in a twelve-day trend with identical rules.
ADX level and slope, ATR-normalised distance from a long EMA, and 4-hour structure are enough to classify regime.
Fix it with a slow higher-timeframe gate on the whole strategy, not with more entry filters per trade.
Test every strategy across both regimes before trusting it. A range-only backtest of a range strategy proves nothing.
Frequently Asked Questions
What is a market regime in trading? A market regime is the prevailing behavioural state of a market, most usefully divided into trending (price moves persistently in one direction with shallow pullbacks) and ranging (price oscillates inside a band and reverts to a mean). Regimes matter because most strategy edges only exist in one of the two states. A strategy tested in a single regime tells you nothing about how it behaves in the other.
How do I know if the market is trending or ranging? Use two or three simple measurements together. ADX above roughly 25 with a rising slope indicates a trend, while readings below 20 indicate a range. Price holding more than about three ATRs from its 200-period EMA for many bars indicates a runaway trend. Consecutive higher highs and higher lows on a 4-hour chart confirm directional structure. When the measurements disagree, treat the market as transitional and reduce exposure.
Why does my trading bot lose money in trending markets?
If your bot is mean-reverting, a trend attacks it twice. First, reversion stops happening, so the win rate drops while the loss size stays fixed. Second, trends make prices look permanently stretched, so the bot generates more signals at precisely the wrong time. A system with small average winners and larger average losers can keep a winning record above 55% and still lose money steadily in a trend.
What is the best indicator for detecting a trend?
No single indicator is best, but ADX is the standard tool for trend strength because it separates directional movement from noise regardless of direction. Its weakness is lag, so pair it with the distance between price and a long moving average measured in ATR units, which reacts faster, and with simple higher-timeframe swing structure. Two of three in agreement is a practical rule for automated gating.
Should I switch my bot off manually when the market trends?
Manual switching works but defeats the purpose of automation and depends on you noticing the regime change in time, which most traders do only after the losses. A better pattern is to encode the regime gate into the strategy itself so the same rules that trade the edge also decide when the edge is allowed to trade. The gate should live on a slower timeframe than the entries so it changes state rarely.
Do trend-following bots have the opposite problem? Yes, symmetrically. A breakout or momentum system bleeds in ranges, where every breakout fails and reverts. Its losses in the wrong regime are usually smaller per trade than a fade system's, because trend systems cut losers quickly by design, but the churn of repeated failed breakouts still erodes capital. The regime gate logic is identical, just inverted: stand down when ADX is low and the market is stuck in a band.
Can one bot trade both regimes? Trying to make one rule set profitable in both regimes usually produces a system that is mediocre in both. The more robust design is two specialised strategies sharing one regime classifier: the fade system trades when the classifier says range, the momentum system trades when it says trend, and neither trades the transition. Each strategy stays simple and testable, and the classifier carries the switching logic.
O n e T a p T r a d e — T h e U n f a i r A d v a n t a g e OneTapTrade is a technology platform for building, backtesting and automating trading strategies. Nothing in this article is financial advice or a recommendation to trade any instrument. All figures are drawn from backtested or simulated (demo) environments; backtested and simulated results do not guarantee future performance. Trading involves substantial risk of loss. Always test strategies on simulated accounts before risking capital.