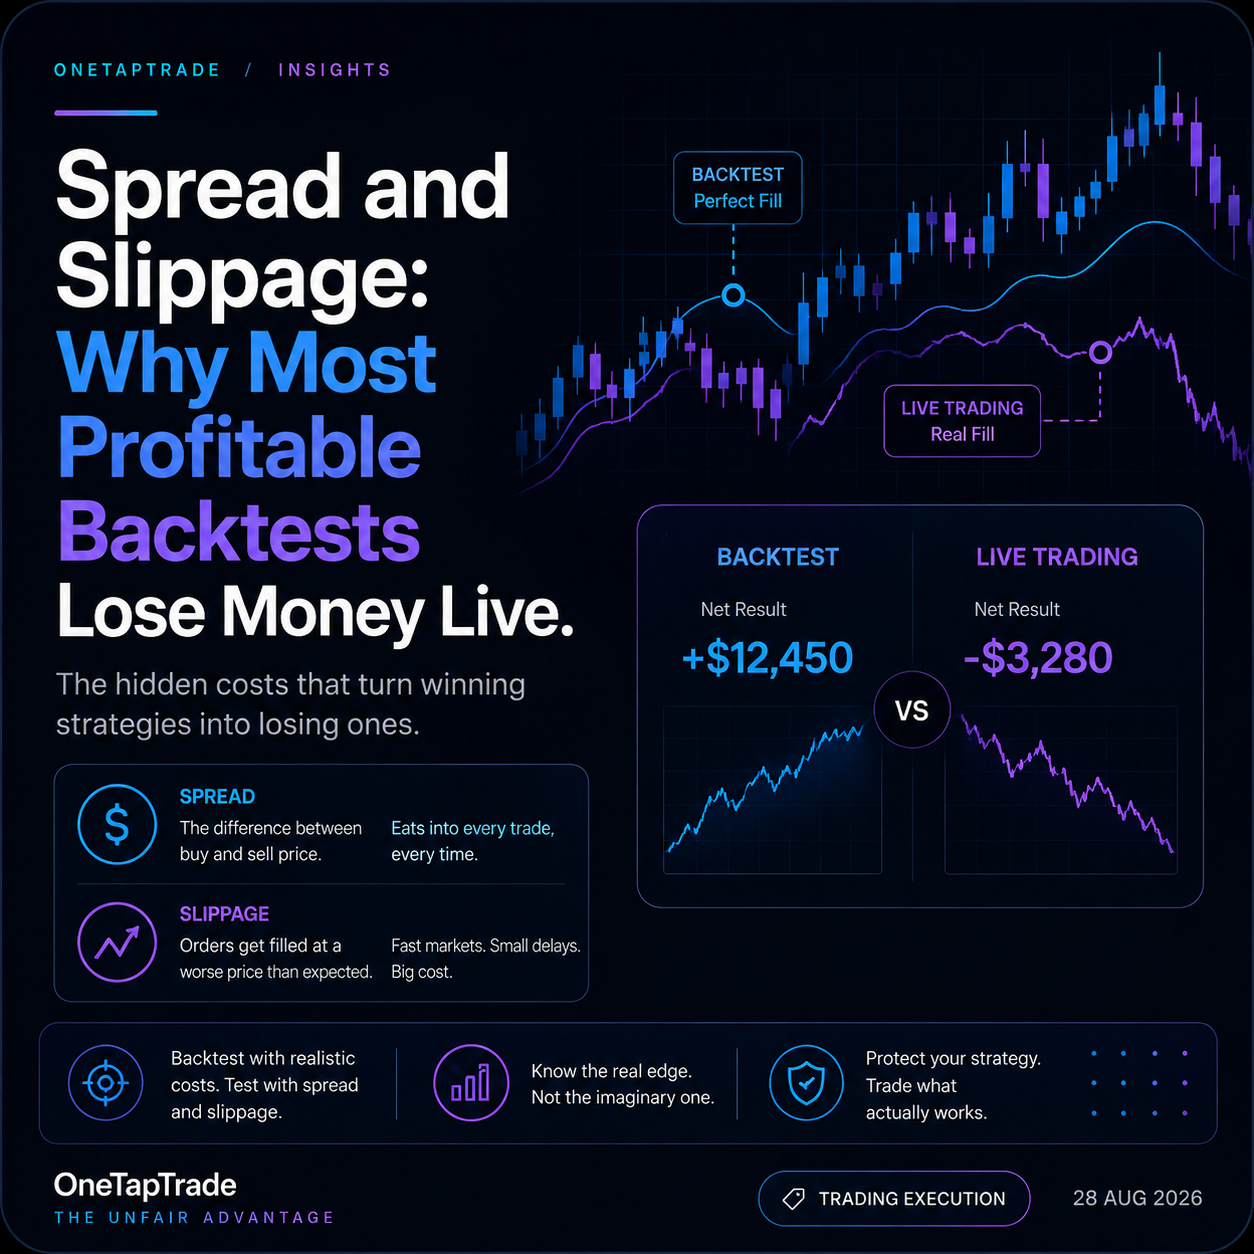
Spread and Slippage: Why Most Profitable Backtests Lose Money Live
O N E T A P T R A D E / I N S I G H T S
Backtests Lose Money Live
Trading costs are not a rounding error you subtract at the end. They are the single largest line item in most high-frequency strategies, and they decide which ideas are real. This guide shows what costs actually did to 9,932 gold trades, why scoring in pips hides the damage, and the one gate that fixed it.
Author: OneTapTrade Team · 28 Aug 2026 · 9 min read · Last updated: 28 Aug 2026
D I R E C T A N S W E R
Spread, commission and slippage are charged per trade, so the more often a strategy trades and the smaller its average win, the larger the share of gross profit they consume. On a three- year gold backtest of 9,932 trades, a 25 pip round-turn cost removed 248,300 pips, which was 78% of the gross profit, and at 35 pips the same strategy went from profitable to a loss. Model costs from the first backtest rather than adding them at the end, and score results in R (profit as a multiple of the money risked) rather than pips, because pips flatter any strategy tested through a period when volatility rose. If a strategy only works at zero cost, you have not found an edge, you have found a fee schedule.
What Do Trading Costs Actually Cost You?
Every round turn pays three separate tolls. You cross the spread on the way in and again on the way out. You pay commission where the broker charges it. And you pay slippage, the gap between the price your rule asked for and the price you were filled at.
None of them scale with how well the trade goes. They are a flat charge levied per trade, which means the arithmetic is brutally simple. Your net edge is your gross edge minus cost per trade, and cost per trade does not care about your win rate, your Sharpe or your conviction.
That flatness is why costs punish frequency so unevenly. A strategy earning 400 pips gross per trade barely notices 25 pips of cost. A strategy earning 30 pips gross per trade loses most of its income to the same charge. Same market, same cost, completely different verdict.
Most backtesting platforms default to zero cost, which is the single most flattering assumption available. Everything looks like an edge before the toll booth.
How Much Damage Does It Actually Do?
Here is a real sweep rather than a hypothetical. The strategy is a gold mean-reversion scalp, tested across three years of five-minute XAUUSD data with 9,932 trades. The rules never changed. Only the assumed cost per round turn changed.
COST PER ROUND TURN NET RESULT (PIPS) PROFIT FACTOR VERDICT
0 pips +319,767 1.21 Looks like a strong system.
20 pips +121,127 1.08 62% of the gross has gone.
25 pips +71,467 1.04 Thin. Survives, barely.
30 pips +21,807 1.01 Statistically indistinguishable from nothing.
35 pips -27,853 0.99 Dead.
Same entry and exit rules throughout, 9,932 trades over three years of XAUUSD five-minute data. Backtested results are illustrative and do not guarantee future performance.
The number that matters is not any single row. It is the slope. Fifteen pips of cost, the difference between a good broker and an average one, is the difference between a system worth deploying and a system that loses money.
At 25 pips the toll was 248,300 pips, roughly 78% of the gross profit. The strategy spent three years working for its broker and kept the tip.
NET PROFIT VS COST PER ROUND TURN · 9,932 GOLD TRADES +319,767 at zero cost +320k
+120k
0 -27,853
0 20 25 30 35 cost per round turn (pips)
Fig. 1 — The cost curve on a high-frequency system. The line crosses zero between 30 and 35 pips.
Why Do High-Frequency Strategies Die First?
Because the toll is charged per trade and the profit is not.
Put it in the only unit that travels: R, your profit as a multiple of the money you risked on the trade. If your stop is 150 pips away, a 25 pip round turn costs you 0.167 R every time you trade. Very few systematic edges are worth more than 0.17 R per trade, so that strategy is dead before the first signal fires. Widen the stop to 750 pips and the same 25 pip cost is 0.033 R. Now a modest edge of 0.05 R survives with room to spare.
Nothing about the signal changed. The only thing that changed is how much you were risking relative to what the broker charges, and that ratio decides whether the idea is viable.
We saw the same conclusion arrive from the other direction on a family of gold fade strategies. Tested on five-minute bars, no configuration in the family survived a 20 pip cost out of sample, with the best test profit factor at 1.02. The same logic moved to fifteen-minute bars, where the average win was three times larger, produced a wick-fade variant at profit factor 1.56 net of costs across 111 trades, holding at 1.41 out of sample.
The lesson is not that a slower timeframe is better. It is that the average win has to be large relative to the toll, and moving to a higher timeframe is the cheapest way to buy that.
Why Does Scoring in Pips Hide the Damage?
This is the subtle one, and it invalidated an entire batch of our own results before we caught it.
Gold’s volatility rose sharply between 2023 and 2026. The median five-minute ATR went from about 92 pips to about 545 pips. A fixed 25 pip round turn is therefore not a fixed cost in any meaningful sense. Measured against the risk on the trade, it fell by roughly a factor of six over those four years.
THE SAME 25-PIP COST, MEASURED IN R · GOLD 5M
0.109 R 0.12 R
0.066 R
0.036 R 0.018 R
0 2023 2024 2025 2026 ATR 92 ATR 151 ATR 275 ATR 545 median 5m ATR, risk assumed at 2.5 ATR
Fig. 2 — A constant pip cost is a shrinking R cost when volatility rises. Pip-scored backtests read that drift as edge.
The practical consequence was stark. Ranked by net pips, 504 high-frequency configurations looked like they had an edge. Ranked in R, not one of them was profitable. The pip ranking had been measuring gold’s volatility, not the strategy.
This applies to any instrument and any multi-year window where volatility trended. If your backtest spans a period where the market got busier, and you scored it in pips or in currency, some of what you are calling edge is the market moving further, not your rules working better.
A Worked Example: The Gate That Fixed It
Faced with 504 dead configurations, the instinct is to go looking for a better signal. That was not the fix. We kept the signal exactly as it was, a simple z-score momentum entry, and added one rule that has nothing to do with prediction: refuse any trade whose stop is closer than 750 pips. That threshold is thirty times an assumed 25 pip round turn, so the toll can never exceed about 3% of the risk on any trade taken.
SAME SIGNAL, SAME EXITS COST GATE OFF COST GATE ON
5,383 2,435 Trades
-0.002 R +0.042 R Expectancy per trade
1.00 1.08 Profit factor (in R)
Profitable years 2 of 4 4 of 4
-10.8 R +103.3 R Total return
Identical entry logic and exit engine in both columns; the only difference is a minimum risk threshold on entry. Net of 25 pips per round turn. Backtested and illustrative.
Cutting more than half the trades produced the entire result, because the trades removed were the ones where the toll was a large fraction of the risk. The strategy also stopped trading almost entirely in the calmest year, taking 19 trades in 2023 against 1,121 in 2026. That is not a bug. When conditions do not pay enough to cover costs, sitting out is the correct behaviour.
Note the honest size of the win. The full result was +103.3 R against a 45.2 R drawdown, with a bootstrap confidence interval on expectancy of -0.005 to +0.092 R, and it was the best of 504 candidates. That is a thin edge repeated often, not a machine. Presenting it as anything more would be the same self- deception the pip scoring produced.
How Do You Model Costs Properly?
Set the cost before the first backtest, not after. If costs enter at the end, every parameter you chose was chosen in a world where trading was free, and those parameters will lean toward frequency.
Use a pessimistic number. Take your broker’s typical spread, double it for news and rollover periods, add commission, add a slippage allowance. If the edge only appears at the optimistic figure, it is not an edge.
Sweep the cost, do not pick one. The useful output is the level at which the strategy dies. A system that survives to 35 pips when you expect to pay 20 has a real margin. One that dies at 22 does not.
Score in R. It makes results comparable across instruments, timeframes and volatility regimes, and it is the only unit in which a cost figure means anything.
Run a random-entry control. Replace your signal with coin flips and keep everything else identical. On the gated gold system, random entries returned -0.023 R per trade at a profit factor of 0.96. A strategy must beat its own exit engine driven by noise, otherwise you have validated the exits, not the idea.
What Mistakes Do Traders Make With Costs?
Backtesting at zero cost "just to see the signal". The zero-cost picture is what leads you to a high- frequency parameter set you would never have chosen otherwise.
Using the advertised spread. Advertised spreads are quiet-hour, best-case figures. What you pay is the average across the sessions you actually trade, including the news minute your breakout bot loves.
Forgetting slippage entirely. Spread is quoted, slippage is not, and on stop-driven entries in fast markets slippage often exceeds the spread.
Optimising trade count upward. More trades means more statistical confidence and more toll. Those two pull in opposite directions and the toll usually wins.
Comparing strategies in pips or currency. Without normalising by risk, you are ranking by volatility exposure.
Treating a marginal net result as a starting point. A system at profit factor 1.01 after costs is not a foundation to improve on. It is a coin flip with extra steps.
Where Does This Fit in Your Workflow?
Costs belong at the very start of the backtest stage, configured before a single parameter is chosen. They are the gate between "this idea is interesting" and "this idea is fundable", and they should kill most candidates. That is the point of them.
Then the forward test tells you what your assumption was actually worth. Compare the fills you get on demo against the prices your rules asked for, and you have a measured slippage figure rather than a guessed one. Feed that number back into the backtest and re-run. If the strategy still stands, you are looking at something real. K E Y T A K E A W A Y S
Costs are charged per trade and do not scale with profit, so frequency is what makes them lethal.
On 9,932 gold trades, a 25 pip round turn removed 248,300 pips, which was 78% of the gross profit.
The same strategy went from +319,767 at zero cost to -27,853 at 35 pips. Fifteen pips separated viable from dead.
Score in R, not pips. Ranked by pips, 504 configurations looked profitable; ranked in R, none of them were.
Gold’s median five-minute ATR rose from 92 to 545 pips across four years, so a fixed pip cost silently shrank as a share of risk.
The fix was a cost gate, not a better signal: refusing trades with a stop closer than 750 pips took expectancy from -0.002 R to +0.042 R.
Sweep the cost rather than assuming one. The level at which the strategy dies is the number that matters.
Always run a random-entry control. Coin-flip entries through the same exits returned -0.023 R per trade.
Frequently Asked Questions
How much spread should I assume in a backtest? Assume more than your broker advertises, because the advertised figure is a quiet-hour best case and you will trade through news, rollover and thin sessions. A workable approach is to take the typical spread for your instrument, add commission converted into the same units, then add a slippage allowance sized to how aggressive your entries are. For gold on a five-minute timeframe, 20 to 25 pips per round turn is a realistic working figure and 35 pips is a reasonable stress test.
Why does my strategy lose money live when the backtest was profitable?
The most common cause is that the backtest was run at zero or optimistic cost. Costs are charged per trade regardless of outcome, so a strategy with a small average win can hand most of its gross profit to the broker without any rule changing. The second most common cause is slippage on entry, which is rarely modelled at all and is largest exactly where fast-moving strategies want to trade. Re-run the backtest with a pessimistic cost figure and compare it against the fills you actually received.
What is a realistic slippage assumption for automated trading? It depends on order type and market speed rather than on your platform. Limit orders inside a liquid session can slip very little, while stop and market orders during a news release routinely slip several times the spread. The reliable method is to measure it: run the strategy on demo, log the price each rule requested alongside the price it received, and use that distribution as your assumption. A guessed number tuned until the backtest looks good is not an assumption, it is a wish.
Should I measure results in pips or in R? In R, meaning profit as a multiple of the amount risked on each trade. Pips and currency both change meaning when volatility changes, so a multi-year backtest scored in pips will credit the strategy for the market simply moving further. In one gold study, 504 configurations that ranked as profitable in pips were all unprofitable once scored in R, because gold’s volatility had risen roughly sixfold over the test window. R is also the only unit in which a fixed cost can be sensibly compared against an edge.
Do trading costs matter less on higher timeframes? Yes, and it is usually the cheapest fix available. Costs are per trade, so what matters is the size of the average win relative to the toll, and higher timeframes produce larger average wins with fewer trades. In one gold study, an entire family of fade strategies failed out of sample on five-minute bars at 20 pips of cost, and the same logic on fifteen-minute bars produced a variant at profit factor 1.56 net of costs. The trade-off is a smaller sample, so the result needs a longer history to reach the same confidence.
Can I improve a strategy that only works at low cost?
Sometimes, but not by adjusting the signal. The productive lever is the ratio between what you risk on a trade and what the trade costs to open. Filtering out trades whose stop distance is too small relative to the toll can turn a break-even system profitable without touching the entry logic at all, because it removes the trades where costs dominate. If no such filter helps, the honest conclusion is that the edge was never larger than the fees.
What is a random-entry control and why does it matter? It is a version of your strategy where the entry signal is replaced by coin flips while the exits, filters and cost assumptions stay identical. If the random version makes money, your result came from the exit engine or from a quirk of the test period rather than from the idea you are testing. On one gated gold system, random entries returned -0.023 R per trade at a profit factor of 0.96, which is what gave the real signal’s +0.042 R its meaning. Run it on every result you intend to trade.
O n e T a p T r a d e — T h e U n f a i r A d v a n t a g e OneTapTrade is a technology platform for building, backtesting and automating trading strategies. Nothing in this article is financial advice or a recommendation to trade any instrument. All figures are drawn from backtested or simulated (demo) environments; backtested and simulated results do not guarantee future performance. Trading involves substantial risk of loss. Always test strategies on simulated accounts before risking capital.