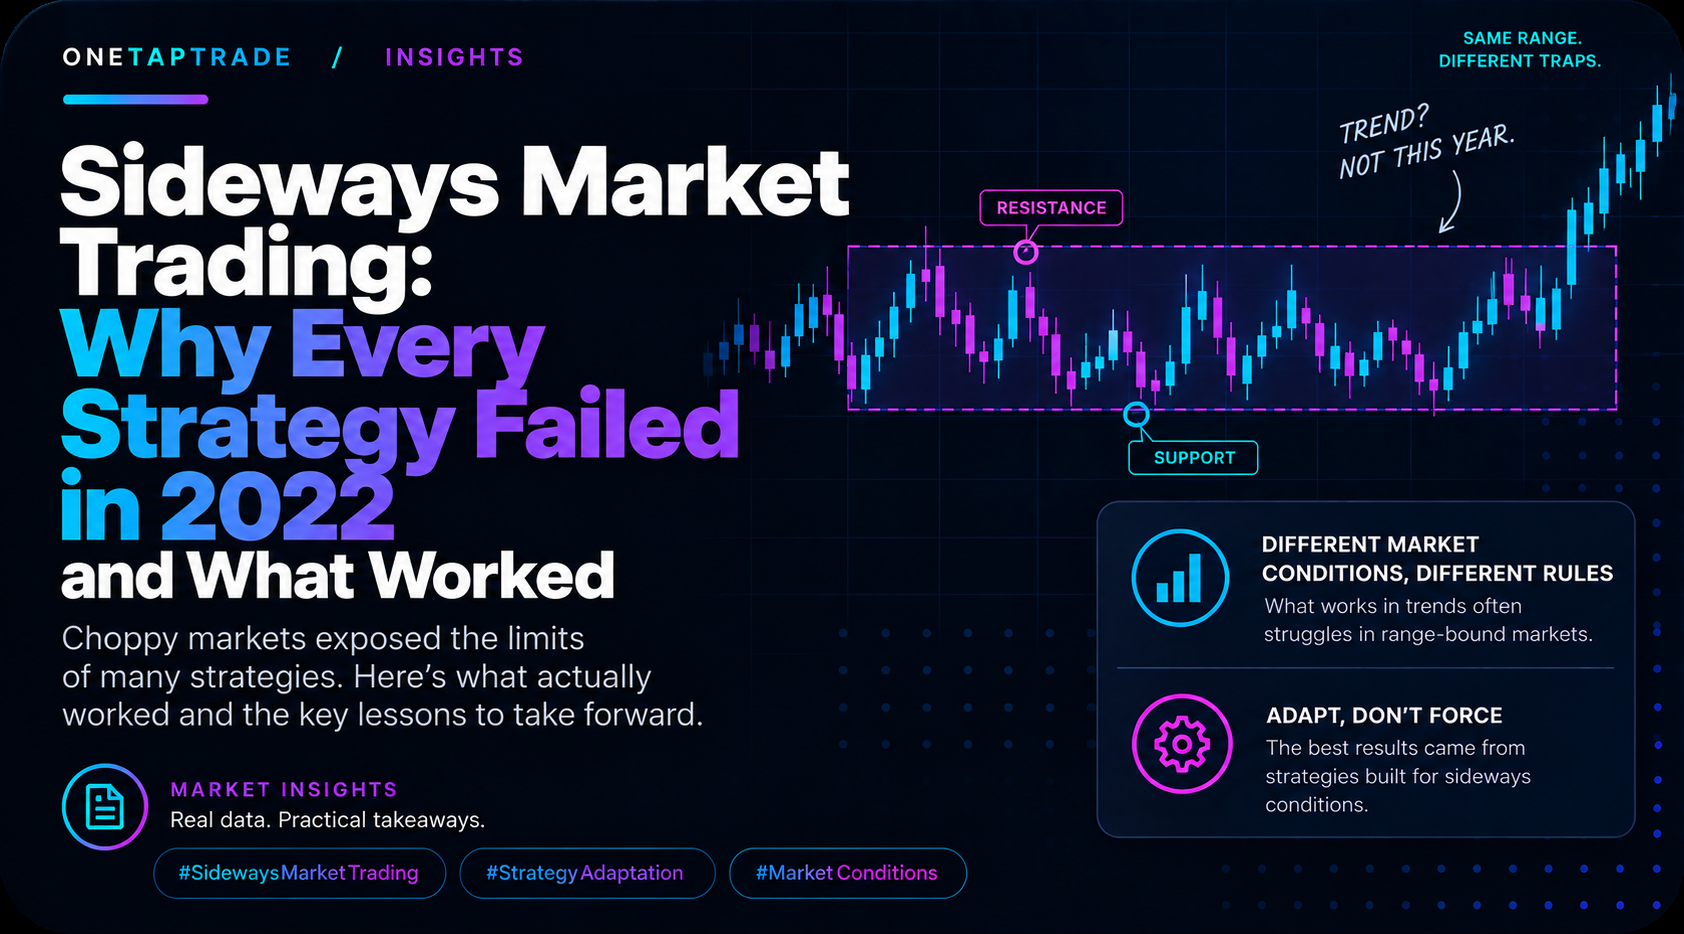
Sideways Market Trading: Why Every Strategy Failed in 2022 and What Worked
O N E T A P T R A D E / I N S I G H T S
Failed in 2022 and What Worked
In 2022 gold traveled an enormous distance and finished one percent from where it started.
Trend following, mean reversion, breakouts: we tested twelve approaches and every one lost.
This is the full autopsy, the measured reasons why, and the two things that actually made money.
Market Regimes Strategy 12 Sep 2026 | OneTapTrade Research
Key takeaways
Gold traveled about 95 volatility units in 2022 and kept 1 percent: a complete round trip that
defeated every strategy family we tested
Breakouts did not merely fail in 2022, they inverted: five days after a breakout, price averaged 1.16 volatility units BEHIND the breakout direction
Price crossed its own 200-hour average 228 times in 2022: control changed hands every day and a half
What worked: fading failed breakouts (+6.6R on gold) and trading the markets the regime rotated INTO (+41.5R on USDJPY, same strategy)
Somewhere in 2022 or 2023, your strategy probably stopped working. Maybe you blamed the parameters and re-optimized. Maybe you blamed yourself. We can offer a better explanation, because we ran twelve different strategy families through that exact period, everything from trend following to mean reversion to pattern trading, and every single one lost. When everything fails at once, the cause is not in any strategy. It is in the market's structure, and it can be measured.
HOW WE TESTED
Every number in this article comes from our own research engine: five years of minute-level price history (2021 to 2026) across nine markets including gold, EURUSD, USDJPY, GBPJPY, CADJPY and Bitcoin. Backtests fill at realistic prices, charge each market's real spread, commission and slippage on every trade, check the stop before the target inside every bar, and never read future data. Results are reported in R, where 1R is the amount risked on the trade, so that different markets and years can be compared honestly.
What does a sideways market actually look like in numbers?
"Sideways" sounds calm. 2022 was anything but. Here is the year, measured:
Gold in 2022 Measured value What it means
about 95 times the Total distance traveled during the year A huge, violent, exhausting year hourly volatility
A complete round trip. Nearly every mile Distance kept at year end 1 percent traveled was later untraveled
Control changed hands roughly every day Crossings of its own 200-hour average 228 and a half, all year
Average follow-through 5 days after aminus 1.16 volatilityBreakouts did not fizzle. They reversed and genuine 20-day breakoutunitspunished
The narrative behind the numbers: in February war headlines spiked gold to its record zone. Then the fastest interest-rate hiking cycle in four decades ground it down for seven consecutive months. Then markets began pricing the end of the hikes and reversed the entire decline. Three enormous stories, each strong enough to fuel a year of trending, stacked inside one year, each canceling the last.
Why did every strategy type lose at the same time?
Trend and breakout strategies: triggered constantly, punished constantly
Here is the cruel part. 2022 did not starve trend systems of signals. It fed them signals continuously. The moves were enormous, so every breakout system fired, every momentum indicator lit up, and trend-strength readings looked healthy on a majority of bars. And then the moves reversed. Our follow-through measurement is the smoking gun: five days after a real, textbook-quality breakout of a 20-day range, price on average sat more than one full volatility unit BEHIND the breakout point. The market was not ignoring breakouts. It was systematically hunting them.
Mean reversion strategies: right thesis, unsurvivable path
Surely the mirror strategy feasted? It did not, and the reason teaches something important. The swings a mean-reversion trader needed to fade were not gentle drifts. They were repricings driven by inflation prints and central-bank decisions, moves of several hundred pips in hours. Fading them early meant standing in front of scheduled macro events. And when the reversion finally came, it arrived as a violent snap that gapped past sensible exits. We tested eleven configurations of mean reversion through this period. Every one lost.
The deep reason, and it is worth internalizing
Every strategy built on price charts, without exception, is a bet that the recent past predicts the near future. Trend systems bet that direction persists. Mean reversion systems bet that the center of the range persists. They disagree about what persists, but they both require something to persist.
In 2022, nothing did. Each scheduled macro event repriced the market and reset the board. Direction did not persist: 228 crossings of the long-term average. The range center did not persist: it migrated violently with every CPI print. When persistence itself disappears from a market, there is no parameter setting, no filter, no clever indicator that can extract edge, because persistence is the raw material every edge is made of. That is why everything failed at once, and why re-optimizing your strategy inside such a window only teaches it to memorize noise.
What trading strategies actually work in a sideways market?
Two things made money through that period in our tests, and they are instructive opposites.
- Trap harvesting: trade the failure, not the breakout
If breakouts systematically invert, then the profitable trade is the other side of each failed breakout. We tested exactly that: when price pokes through a significant level but cannot hold, closing back inside the range, enter against the failed move, betting on the trapped traders being forced out.
Result: +6.6R on gold in 2022, the precise year everything conventional bled. With a regime filter that only allows this strategy when the market shows the whipsaw fingerprint, it earned +10.5R in 2022 across just 14 careful trades.
Full honesty, because this matters: the same strategy loses heavily in genuine trend years, minus 34R in one strong year in our sample. It is a specialist tool for a specific regime, not a replacement system. Deployed alone and always-on, it fails like everything else, just in different years.
- Going where the regime went: the rotation nobody watches
The most important finding of the whole autopsy: the persistence that vanished from gold did not vanish from the world. The same macro force that whipsawed gold, aggressive US rate hikes against a Japanese central bank holding rates at zero, expressed itself as the cleanest currency trend in our five-year dataset.
Market, 2022 The identical breakout strategy's result
Gold lost 14.5R
USDJPY made +41.5R
CADJPY made +32.9R All three as a portfolio +59.9R: the best portfolio year in the sample
Read that again: the same code, the same parameters, in the same year, produced the worst gold result and the best yen result. The trader watching one market experienced a broken strategy. The trader watching three experienced a rotation. Nothing about the strategy changed. Only its address did.
How do you recognize this regime while it is happening?
The practical detector our research settled on is almost embarrassingly simple: count how many times price has crossed its own 200-period average within the last 200 bars. A healthy trending market crosses rarely, because one side keeps control for weeks. In 2022 the count sat above 14 for long stretches, meaning control changed hands every few days, all the time.
Measured on our data: trades entered while that crossing count was 14 or higher averaged minus 0.11R. Trades entered below it averaged plus 0.17R. One number, computable live on any chart, separating the
environment where strategies work from the one where they historically have not.
Honest limitation: the counter looks back 200 bars, so it turns red only after the first week or two of damage. Nothing causal can flag a regime change before the regime has changed. What it can do is keep you out of the middle and the end of a 2022, which in our measurements was worth roughly half the year's losses.
The honest ceiling: on the whipsawing market itself, the best realistic outcome is roughly breakeven. Filters halve the bleeding. Trap-trades claw back some. Nothing on that market turns the year genuinely profitable, and anything that claims to in a backtest has probably memorized the year rather than survived it. The profit of 2022 lived on other markets. The job on gold was to still be standing.
The playbook, condensed
- Run a regime health check (the crossing count) on every market you trade. Treat 14+ per 200 bars as a
storm warning.
- When the storm flag is up: stop opening new trend trades on that market. Let existing ones manage
themselves out.
- Expect nothing from that market. A flat year during its whipsaw IS the win. Judge your system on the
portfolio, not the victim market.
- Look for where the driver went. A macro force that scrambles one market usually powers a clean move
somewhere else, most often in the currency pairs most directly exposed to it.
- Never re-optimize inside the whipsaw window. Walk-forward validation across multiple years exists
precisely to stop 2022 from teaching your system permanent bad habits.
Frequently asked questions
How do you know when a market is going sideways?
Count crossings of the 200-period average over the last 200 bars. Fourteen or more means no side has held control, and our measurements show strategy edges historically vanish in that state. Efficiency measures like the ratio of net movement to total movement tell the same story with more math.
Should I stop trading in a choppy market?
Stop opening new positions in the flagged market; do not panic-close existing ones. In our tests, blocking fresh entries during the measured chop state cut the bad-year losses roughly in half while giving up almost nothing in the good years.
What is the best strategy for a range-bound market?
Fading failed breakouts at the range extremes measured best, and it is the only approach we found that was actually positive through 2022. But it must be regime-gated: the same strategy loses heavily once a real trend starts.
Can optimization fix a strategy that loses in sideways markets?
No, and this is measurable: optimizing inside a no-persistence window fits noise, and the tuned parameters collapse the moment the regime changes. Honest walk-forward testing across several years exists to catch exactly this failure.
Do sideways markets happen often?
Episodes of several days to several weeks happen every year on every market. Year-scale round trips like 2022 are rarer, driven by conflicting macro forces of similar strength. Our five-year sample contains one such year, and it was enough to erase three ordinary years of profit for unprotected trend systems.
Data: 5 years of bars, 9 markets, 2021 to 2026, measured on our backtesting OneTapTrade | The Unfair Advantage | engine onetaptrade.com