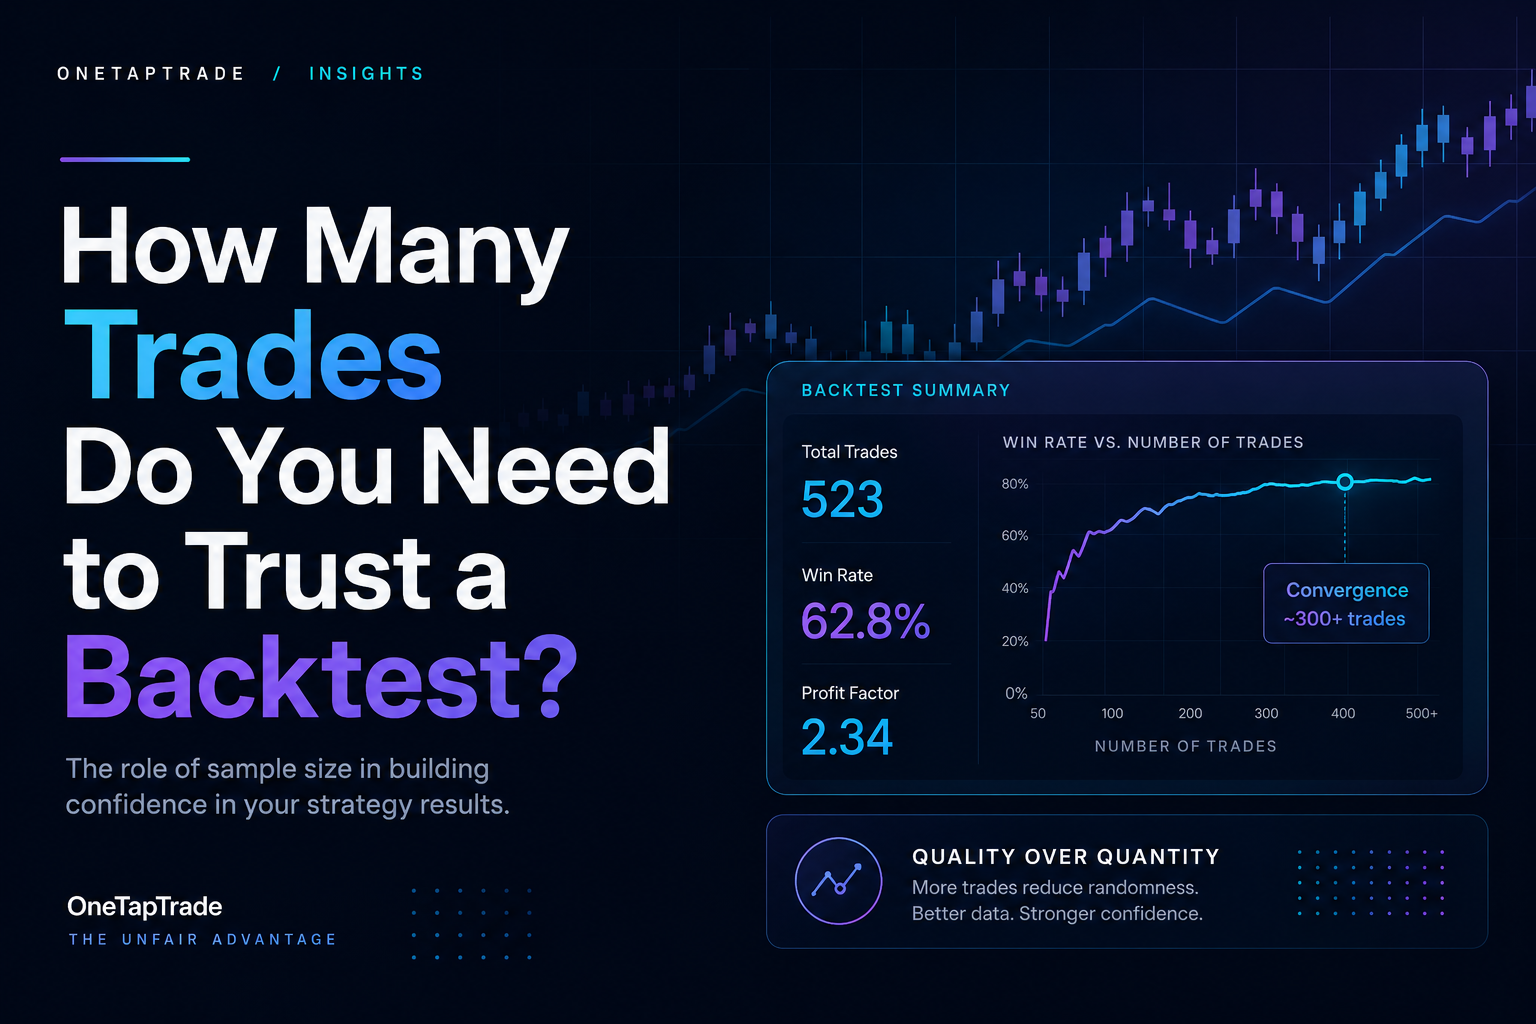
How Many Trades Do You Need to Trust a Backtest
O N E T A P T R A D E / I N S I G H T S
Backtest?
Twenty trades can make a coin flip look like an edge. This guide puts real numbers on backtest sample size: how wide the uncertainty actually is at 20, 50, 100 and 500 trades, why losing streaks are longer than intuition expects, and the practical thresholds that separate evidence from noise.
Author: OneTapTrade Team · 24 Aug 2026 · 8 min read · Last updated: 24 Aug 2026
D I R E C T A N S W E R
As a practical rule, treat anything under 30 trades as an anecdote, 50 to 100 trades as a first indication, and 300 or more trades as the point where win rate and profit factor become genuinely trustworthy. The reason is simple statistics: over 20 trades, a true 55% win-rate strategy can plausibly show anything from 33% to 77%, a band so wide it contains both "losing system" and "world class". The band narrows with the square root of the trade count, so trust grows slowly, and it also requires those trades to span different market conditions, not just one lucky month.
Why Does Sample Size Decide Everything?
Every backtest statistic is an estimate measured with noise, and the noise shrinks slowly. Win rate, profit factor and average R-multiple are all averages over the trade list. Averages over small lists swing wildly: one outlier winner in a 20-trade sample moves the profit factor more than the strategy’s actual edge does.
This is why small-sample results feel so convincing and are so treacherous. A hot 15-for-20 streak looks like proof. It is comfortably inside the range of outcomes a mediocre strategy produces by chance. Until the sample is large enough to squeeze luck out of the numbers, you are not evaluating a strategy, you are admiring a dice roll.
What Is the Maths Behind It?
For win rate, the uncertainty follows a simple formula. The standard error of a measured win rate is sqrt(p(1-p)/n), where p is the win rate and n is the trade count. Doubling your certainty requires quadrupling your trades. Here is what that means for a strategy whose true win rate is 55%, a typical figure for a decent intraday system. The table shows the range the measured win rate will plausibly fall in (the 95% confidence band) at each sample size:
TRADES IN BACKTEST 95% BAND AROUND 55% BAND WIDTH VERDICT
20 33% - 77% ±22 pts Anecdote. Contains losing and elite systems.
50 41% - 69% ±14 pts First hint. Still spans break-even.
100 45% - 65% ±10 pts Indication. Edge vs no-edge still blurry.
300 49% - 61% ±6 pts Usable. Most pretenders are excluded.
500 51% - 59% ±4 pts Trustworthy for sizing decisions.
1,000 52% - 58% ±3 pts Statistically solid.
Bands computed as ±1.96 standard errors for a true 55% win rate. Values are illustrative; profit factor and drawdown estimates converge even more slowly than win rate because they are dominated by the largest trades.
Run the logic in reverse and it gets sobering. A strategy with no edge at all, a 50% coin flip with symmetric payoffs, has roughly a 25% chance of showing a 60%+ win rate over 20 trades. Over 100 trades that chance collapses to about 3%. Sample size is not a formality. It is the only thing standing between you and funding a coin flip.
THE UNCERTAINTY CONE · true win rate 55%
70%
true 55%
50% break-even 50%
30% 20 50 100 300 500 1000 trades in sample
Fig. 1 — The 95% confidence band around a true 55% win rate. Below ~100 trades the band still straddles break-even.
A Worked Example: Two Bots, One Hot Start
Two gold bots each finish their first 20 demo trades at 14 wins, 6 losses, a 70% win rate. Identical scorecards. One is a genuine 60% system; the other is a 48% system on a lucky run. At 20 trades the two are statistically indistinguishable, and both look brilliant.
Run them to 300 trades and the story separates. The genuine system settles near 60%, comfortably above its 52% break-even (its winners average 1.1R against 1.0R losers). The pretender drifts down toward 48% and its equity curve rolls over. Nothing changed inside either bot between trade 20 and trade 300. The only thing that changed is that luck ran out of room to hide.
This is also why our own forward tests are judged on hundreds of trades. A recent three-week demo run of a mean-reversion gold system closed 368 trades, enough to shrink the win-rate uncertainty to about ±5 points, which is what made its conclusion (profitable in ranges, unprofitable in trends) a finding rather than an impression.
How Do Losing Streaks Fit In?
Small samples also wreck intuition about streaks, in the other direction. For a 55% win-rate system, the longest losing streak you shouldexpect to see grows with the trade count: around 6 consecutive losses somewhere in 100 trades, and around 7 in 300 trades. These are normal operating conditions, not evidence of failure.
This cuts both ways:
Do not abandon a validated strategy over a 5-trade losing streak. A healthy 55% system produces one routinely. Abandoning strategies at every expected streak guarantees you never hold anything long enough for its edge to pay.
Do size for the streak before it happens. At 1% risk per trade, a 7-loss streak is a 6.8% drawdown, uncomfortable but survivable. At 5% risk per trade the same ordinary streak is a 30% hole. The streak is a certainty over enough trades; whether it is a bruise or a burial is a position-sizing choice made in advance.
What Mistakes Do Traders Make With Sample Size?
Counting trades but not conditions. 500 trades from one calm quarter is one observation of one regime, repeated. Trades must span trends, ranges and news weeks before the count means what it appears to mean.
Trusting profit factor at small n. Profit factor converges even more slowly than win rate because one large winner dominates the ratio. A PF of 2.0 over 40 trades routinely becomes 1.2 over 400.
Restarting the count after every tweak. Each parameter change creates a new strategy whose evidence starts at zero. Ten versions with 50 trades each is not 500 trades of evidence, it is ten anecdotes.
Ignoring the multiple-testing trap. If you backtest 100 random variants, a few will show 300-trade excellence by chance alone. The more combinations you searched, the more out-of-sample confirmation the winner needs.
Waiting forever. Sample size is a dial, not a wall. 100 trades is enough to reject a clearly broken strategy and enough to justify continuing a promising one on demo. Certainty is never available; calibrated confidence is.
Where Does This Fit in Your Workflow?
Use sample size as the promotion criterion between pipeline stages. A backtest needs a few hundred trades spanning multiple regimes before the strategy deserves walk-forward analysis. A forward test needs 50 trades minimum, ideally 100, before its verdict counts. And a live strategy earns size increases in steps, each justified by the growing live sample, not by a good week. The question is never "is the strategy winning?" but "over how many trades, in how many conditions?"
K E Y T A K E A W A Y S
Under 30 trades is an anecdote, 50 to 100 is an indication, 300 or more is evidence you can act on.
Win-rate uncertainty shrinks with the square root of trade count: quadruple the trades to halve the noise.
Over 20 trades, a no-edge coin flip shows a 60%+ win rate about a quarter of the time.
Profit factor is even noisier than win rate at small samples because outlier trades dominate it.
A 55% system should produce a 6 to 7 trade losing streak somewhere in every few hundred trades. Size for it in advance.
Trades must span different market regimes to count. One quiet month sampled 500 times is still one month.
Every parameter tweak resets the evidence clock. Ten tweaked versions with 50 trades each is ten anecdotes, not 500 trades.
Frequently Asked Questions
How many trades should a backtest have to be reliable?
A practical ladder: 30 trades is the bare minimum to say anything at all, 100 trades gives a first usable estimate with roughly ±10 points of win-rate uncertainty, and 300 to 500 trades is where win rate and profit factor become stable enough to base sizing decisions on. Just as important, those trades should span different market conditions, because 500 trades from a single quiet regime measure that regime, not the strategy.
Is a 70% win rate over 20 trades good?
It is encouraging and unproven. The 95% confidence band on 20 trades is roughly ±20 percentage points, so a measured 70% is statistically compatible with a true rate anywhere from about 50% to 90%. A strategy with no edge at all will post 70% or better over 20 trades reasonably often. Treat it as a reason to keep testing to 100 or more trades, not as a reason to increase size.
Why did my profitable backtest fail with more data? Usually one of two reasons. Either the original sample was small enough that luck accounted for most of the measured edge, which more data then averaged away, or the original window covered a market regime that suited the strategy and the extended window included the regime that does not. Both failures are detected the same way: more trades, across more conditions, before trusting the numbers. How long a losing streak is normal for a trading strategy?
Longer than intuition says. A 55% win-rate strategy should expect a longest losing streak of about 6 in any 100- trade stretch and about 7 across 300 trades, purely from chance. A 45% win-rate trend system should expect streaks of 8 to 10. The streak only becomes evidence of a broken strategy when it is well beyond what the win rate predicts, or when it coincides with a measurable regime change.
Does a longer backtest period matter more than more trades? They answer different questions and you need both. Trade count controls statistical noise in the performance estimates. Calendar span controls how many market regimes, news cycles and volatility environments the strategy has been exposed to. A high-frequency strategy can rack up 1,000 trades in one unrepresentative quarter, while a slow strategy might need five years to reach 300 trades. Judge the count and the coverage separately.
How many trades before going live with a strategy? A defensible sequence: a backtest of at least 300 trades across mixed conditions, a walk-forward pass whose out-of-sample results hold up, then a forward test on demo of at least 50 and preferably 100 trades with the rules frozen. After that, go live at minimum size and let the live sample grow before each size increase. The pattern throughout is that evidence, measured in trades and conditions, buys each promotion.
Can a strategy be trusted with a small sample if the logic makes sense?
Sound logic earns a strategy the right to be tested, not the right to be trusted. Markets are efficient enough that most sensible-sounding ideas still fail, and the failure only shows up in the numbers. A plausible mechanism plus a small sample is a hypothesis. A plausible mechanism plus several hundred trades across regimes is a system. The logic decides what to test; the sample decides what to fund.
O n e T a p T r a d e — T h e U n f a i r A d v a n t a g e OneTapTrade is a technology platform for building, backtesting and automating trading strategies. Nothing in this article is financial advice or a recommendation to trade any instrument. All figures are drawn from backtested or simulated (demo) environments; backtested and simulated results do not guarantee future performance. Trading involves substantial risk of loss. Always test strategies on simulated accounts before risking capital.