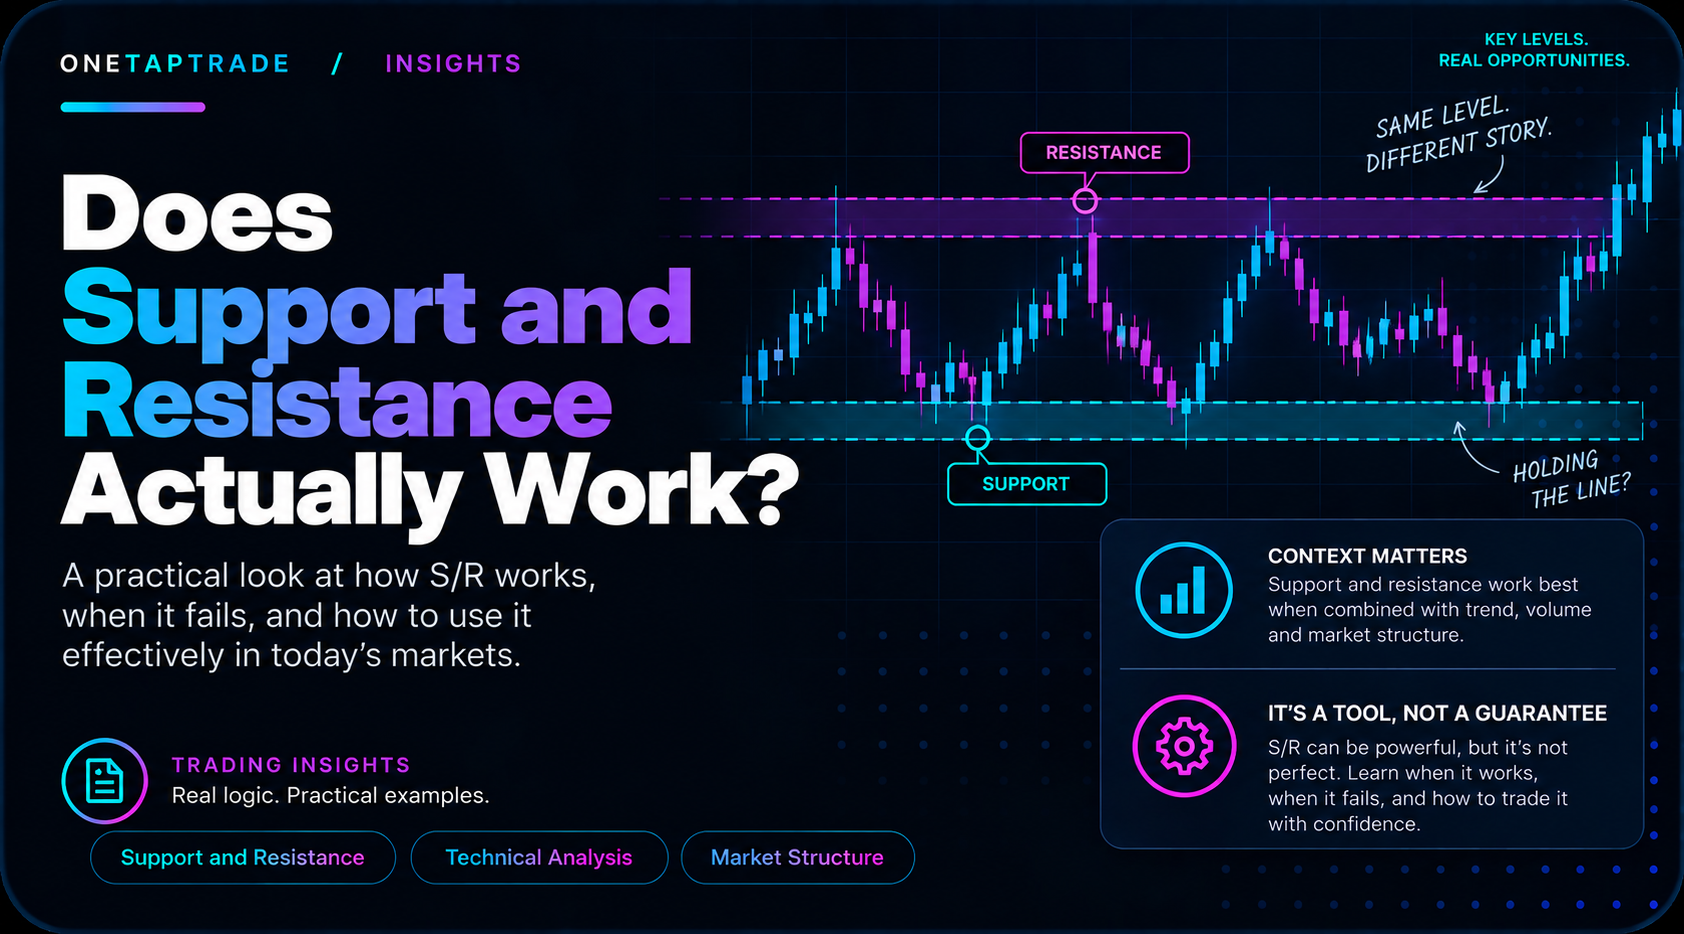
Does Support and Resistance Actually Work?
O N E T A P T R A D E / I N S I G H T S
We Tested 5 Years of Data
Measured support and resistance levels bounced 77.9 percent of the time. Randomly placed
levels bounced 78.1 percent. That result should upset almost everyone. But two level-based
trades did survive testing, and they point at what price levels are really for.
Support Resistance Price Action 12 Sep 2026 | OneTapTrade Research
Key takeaways
Measured levels bounced no more often than randomly placed levels: 77.9 percent vs 78.1 percent, with identical payoff ceilings
Heavily tested levels broke more often than they held in our data: each touch consumes the orders defending the level
The two level trades that survived testing: fading failed breakouts, and structure retests with strict confirmation rules
Levels are locations, not signals: the tradeable information is the behavior at the level, never the level itself
Support and resistance is the first thing every trader learns. Draw a line under the lows, a line over the highs, buy the floor, sell the ceiling. It is also, as far as we can tell, the least tested belief in all of retail trading. Everyone draws the lines. Almost nobody checks whether the lines do anything.
We checked. This article is the full account: how we tested it, the result that should bother you, the deeper reason the classic playbook fails, and the two level-based trades that genuinely survived, because the story is not that levels are useless. The story is that almost everyone uses them backwards.
HOW WE TESTED
Every number in this article comes from our own research engine: five years of minute-level price history (2021 to 2026) across nine markets including gold, EURUSD, USDJPY, GBPJPY, CADJPY and Bitcoin. Backtests fill at realistic prices, charge each market's real spread, commission and slippage on every trade, check the stop before the target inside every bar, and never read future data. Results are reported in R, where 1R is the amount risked on the trade, so that different markets and years can be compared honestly.
How the level test worked
We built a walk-forward level book on five years of gold: every confirmed swing high and low, merged into levels when several swings landed within a volatility-scaled tolerance of each other, each level's touches counted, and the outcome of every subsequent revisit recorded. Nothing was drawn in hindsight. A level existed in the book only from the moment it was knowable, exactly as a live trader would have had it.
Then the control: the identical bounce-measurement machinery pointed at levels placed randomly, with no relationship to prior price action at all. If real levels carry information, they must outperform random lines. That is the entire bar they had to clear.
Do price levels really hold? The result
Metric Real measured levels Random control levels
Short-term bounce frequency on a revisit 77.9% 78.1%
Average payoff ceiling per bounce 0.54R 0.53R
They did not clear it. Real levels bounced no more often than lines placed by a random number generator, and when they did bounce, the bounce was worth no more. Two different measurements, both statistically indistinguishable from noise.
Why do levels LOOK like they work, then?
Because price bounces from almost everywhere, almost all the time. Markets are locally mean-reverting:
most small pushes retrace a little regardless of what they touched. Stand a line anywhere in that environment and you will observe "reactions" at it roughly four times out of five, which is precisely what both our real and random levels showed. The bounce you see at your level is real. The level causing it is the illusion. Your chart is not lying to you about the bounces. It is lying to you about the credit.
Add hindsight selection, you remember the clean holds and quietly redraw the levels that failed, and the belief becomes self-sealing. A walk-forward test cannot redraw anything, which is exactly why its numbers disagree with your memory.
The finding that inverts the playbook: tested levels break
The classic rule says a level grows stronger with each successful test. Our data says the opposite: heavily tested levels broke more often than they held.
The mechanism makes sense once you think about what a level physically is: a cluster of resting orders. Every defense of the level consumes some of those orders. The buyers who defended support on touch one and touch two have bought; their ammunition is spent. By the fourth test, price is usually meeting an emptier order book wearing the same price tag, while the crowd, taught by the earlier bounces, piles in with stops just beyond the line, stops which are themselves the fuel for the eventual break. The strong-looking level is often the most crowded, most consumed, most breakable structure on the chart.
Which support and resistance trades actually work?
Here is where the story turns, because two level-based approaches did survive five years of honest testing, and both use the level in a completely different way from the classic playbook.
- The failed breakout trap
A level's most informative moment is not its defense. It is its break, and specifically its FAILED break. When price pushes through a meaningful level and cannot hold, closing back inside, something real and measurable has happened: breakout traders entered and are now trapped underwater, and their forced exits become fuel for the reverse move. That is not folklore about invisible walls. It is positioning, and positioning is real.
Measured: fading failed breakouts of significant levels produced +6.6R on gold in 2022, the single hardest year in our sample, the year in which every conventional strategy family lost. With a regime filter allowing the strategy only when the market shows whipsaw characteristics, it earned +10.5R that year across 14 selective trades. Full honesty as always: the same approach loses in strong trend years and must be regime-gated. It is a specialist, and a genuine one.
- Structure plus retest, with strict rules
The second survivor trades levels WITH the market's structure rather than against all comers: when a structural break occurs, wait for price to return to the zone that launched the break, and enter only on a confirming close back out of the zone, in the direction of the prevailing structure. One trade per zone, ever. Stops placed beyond the zone, where the idea is structurally wrong. A regime filter that stands aside in chop.
Measured across five years: +0.098R per trade, positive in five of six years with the filter on. Modest, real, and instructive, because every one of its rules exists to add the thing the raw level lacks: context and confirmation. Strip those rules away and you are back at the coin flip in our headline table.
The distinction that saves you: "price is at support, so buy" tested as a coin flip minus costs. "Price broke structure, returned to the origin of the break, and confirmed with a close in the structure's direction" tested as a small durable edge. Levels are locations. The trade is the behavior at the location. Anyone selling you the first sentence is selling you the random-line result.
How to use support and resistance honestly: the working rules
- Use levels as a map, never as signals. Computed levels with touch counts tell you where the
interesting collisions will happen. They do not tell you the outcome, and the data says they cannot.
- Never place blind limit orders at a line. Demand the reaction first: a rejection close, a trap wick
through-and-back, a structural shift. Confirmation is not caution. In this data, confirmation IS the edge.
- Respect broken levels more than held ones. A clean break-and-hold has trapped an entire side of the
market at a known price. The flip retest, old support acting as new resistance, at least has forced participants behind it.
- Trade levels with the structure, not against it. Our surviving system took level trades only in the
direction of the prevailing structural trend. Counter-structure level trades are how the 78 percent illusion converts believers into liquidity.
- Watch the touch count with the opposite instinct. First and second touches are where defenses are
freshest. A fourth touch is not confirmation of strength. In our data it is a countdown.
Frequently asked questions
Why does support and resistance seem to work on my charts?
Two compounding illusions: markets bounce a little from almost everywhere, so any line collects "reactions", and hindsight lets you keep the clean levels while forgetting the failures. A walk-forward test removes both illusions, which is why its numbers disagree with your experience.
Do institutions trade support and resistance levels?
Institutions care about where orders and stops cluster, which is often near obvious levels, but their trade is usually the liquidity event at the level, the sweep and the trap, rather than the naive bounce. That is consistent with which level-trades survived our testing.
Are round numbers real support and resistance?
Round numbers attract orders, including dense stop clusters just beyond them, which makes them favorite sweep targets. Treat them as magnet-and-trap zones, not walls.
Is support and resistance better on higher timeframes?
Higher-timeframe levels give each touch more meaning and less noise, but the control-test conclusion held everywhere we looked: the level alone is not the edge. The confirmed reaction at the level is.
What is the strongest level-based setup?
In our five years of measurements: the failed breakout, a push through a significant level that closes back inside, traded against the trapped side, ideally when the broader market is in a whipsaw regime. It was the only level trade that made money in 2022.