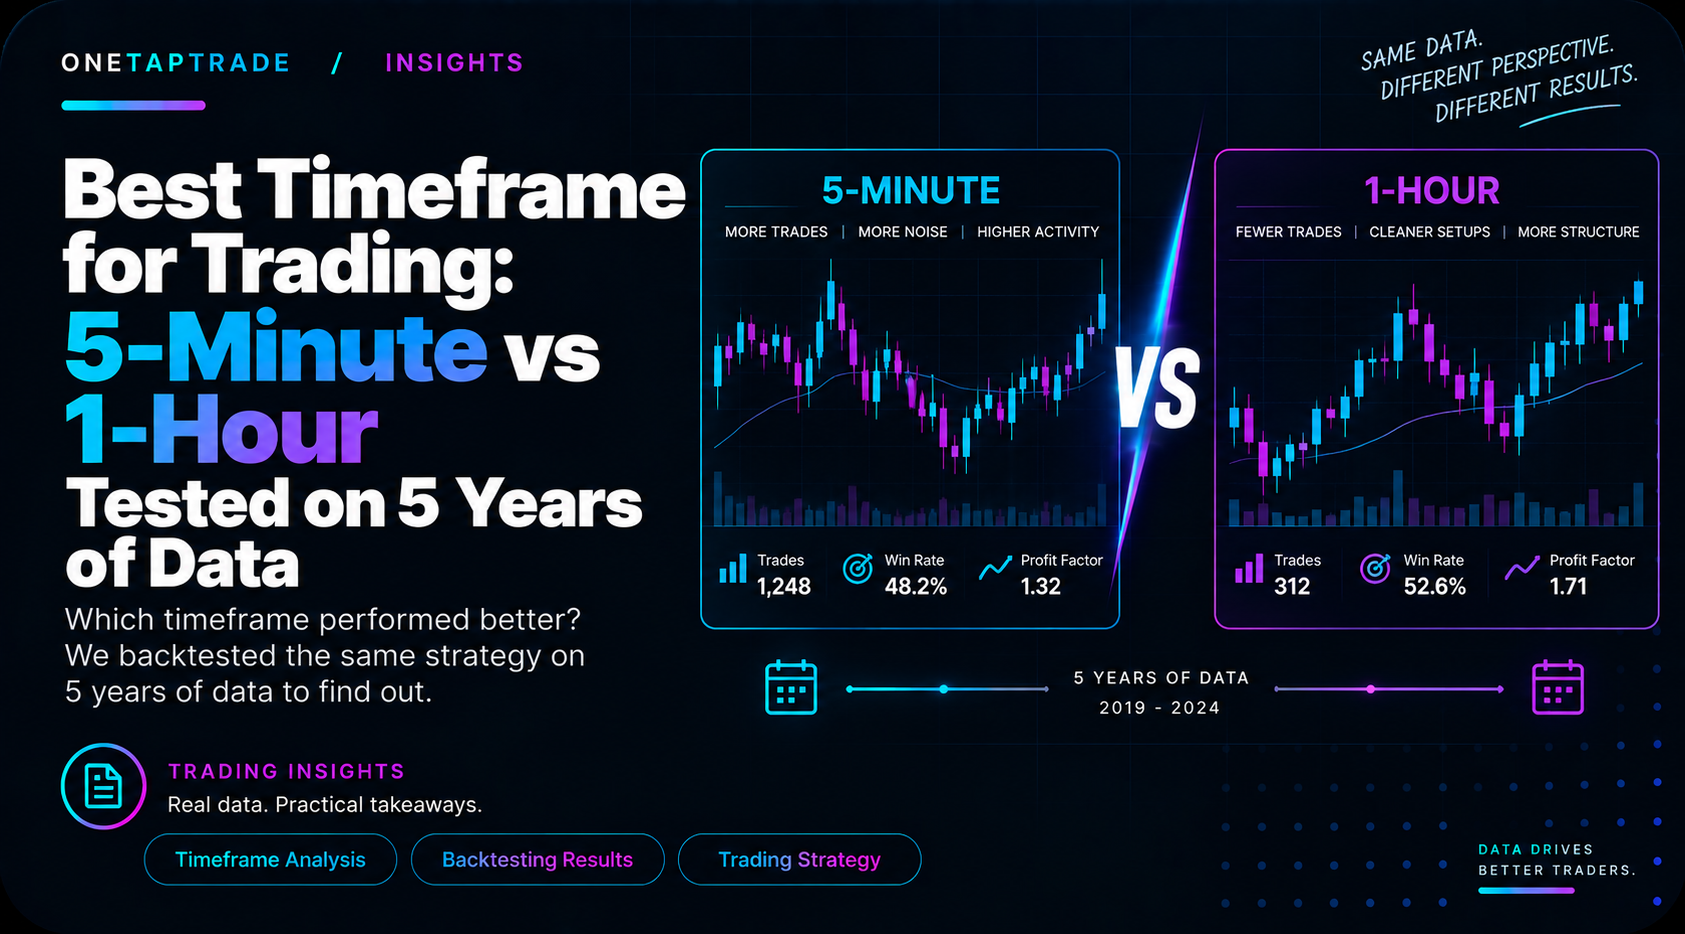
Best Timeframe for Trading: 5-Minute vs 1- Hour Tested on 5 Years of Data
O N E T A P T R A D E / I N S I G H T S
Hour Tested on 5 Years of Data
We ran identical strategies on 5-minute and 1-hour charts across five years of gold data. Every
1-hour version that worked made money. Every 5-minute version lost. The killer is not the
strategy and it is not you. It is arithmetic, and this article shows you all of it.
Timeframes Trading Costs 12 Sep 2026 | OneTapTrade Research
Key takeaways
The same breakout strategy made +36R on the 1-hour chart and lost the equivalent of 303R on the 5-minute chart
A 979-trade 5-minute backtest paid about 32,300 pips in costs against a 30,300 pip total loss: the entire failure was friction
Costs are charged per trade while opportunity is earned per unit of time, so trade frequency is a cost, not an achievement
Bar-count parameters silently change meaning when you switch timeframes and must be rescaled by the bar ratio
Every trader feels the pull of the lower timeframes. More candles means more setups, more action, faster feedback, and the intoxicating sense that the market is offering you opportunity every few minutes. We spent a long time testing what that action actually costs, with the same strategies, the same five years of gold data, and the same realistic spread, run side by side on 5-minute and 1-hour charts. The result was not a close call, and understanding why will save you more money than almost any indicator ever will.
HOW WE TESTED
Every number in this article comes from our own research engine: five years of minute-level price history (2021 to 2026) across nine markets including gold, EURUSD, USDJPY, GBPJPY, CADJPY and Bitcoin. Backtests fill at realistic prices, charge each market's real spread, commission and slippage on every trade, check the stop before the target inside every bar, and never read future data. Results are reported in R, where 1R is the amount risked on the trade, so that different markets and years can be compared honestly.
5-minute vs 1-hour chart: the head to head results
Strategy On the 5-minute chart On the 1-hour chart
Moving average crossoverLost 40R at best; all four variants tested Made +35R, profit factor 1.47 (20/100)were negative
Channel breakout, turtle styleLost the equivalent of 303R across 979Made +36R, profit factor 1.47, (20-day channel)tradesonly 174 trades
Mean reversion fade to theLost 798R across 11 configurations, everyStill marginal, but 5 to 8 times meanone negativebetter per trade
Every configuration tested negative, profitPositive as a structure system Level-break pattern system factor 0.76 to 0.96with proper rules
Four different strategy philosophies. Not one of them survived on the 5-minute chart. Every single 1-hour counterpart of the same idea did better, and the good ones were genuinely, durably profitable. When a result is that one-sided across that many different approaches, the cause is not in the strategies. It is structural.
Why does the same strategy lose on lower timeframes? The cost
ledger
Here is the structural cause, and it fits in one sentence: costs are charged per trade, but opportunity is earned per unit of time.
Spread and slippage do not care how long your trade lasts. Every round trip on gold costs a retail account roughly 33 pips, whether the position is held for three minutes or three days. Now follow the arithmetic of moving from 1-hour to 5-minute bars:
There are twelve 5-minute bars in every hour, so signals arrive many times more often. In our turtle test, the 1-hour version placed 174 trades over five years. The 5-minute version placed 979.
Each of those trades pays the same 33 pip toll. Total cost bill for the 5-minute version: roughly 32,300
pips.
The 5-minute version's total loss over the window: roughly 30,300 pips.
Sit with that pair of numbers. The 5-minute strategy's entries and exits, before costs, were roughly breakeven. It was not a stupid strategy. The entire loss, all of it, was the friction bill. The strategy donated five years of effort to the spread, 33 pips at a time, 979 times.
Meanwhile the average move each 5-minute trade could realistically capture shrank, because a 5-minute swing is simply smaller than a multi-day trend. Costs went up twelvefold in frequency while the prize per attempt went down. There is no parameter that fixes this, because no parameter changes the spread. The cost-share rule of thumb
Divide your per-trade cost by your average expected profit per trade. On the 1-hour turtle, 33 pips of cost stood against winners measured in many hundreds of pips: costs consumed a small share of the edge. On the 5-minute version, 33 pips stood against average captures of a similar order of magnitude: costs consumed approximately all of it. Our working rule from the data: if the round-trip cost is more than about 10 to 15 percent of your average expected win, the timeframe is eating your strategy alive.
The second killer: your parameters change meaning when the
timeframe changes
This one is subtler and catches even experienced builders. Strategy parameters counted in bars are secretly denominated in time, and switching timeframes silently redenominates them.
A 20-day channel is 480 bars on a 1-hour chart. Port that strategy to 5-minute bars without touching the code, and the same 480 bars now spans barely 1.7 days. Your patient, multi-week breakout system just became a twitchy short-term system that fires on every minor fluctuation, and nothing in the code announced the change.
Parameter written as Meaning on 1-hour bars Meaning on 5-minute bars
480-bar channel 20 trading days 1.7 days
72-bar time stop 3 days 6 hours
200-bar average Over a week of structure Less than one session
We watched this exact failure in a real test: a profitable 1-hour system, moved to 5-minute data unchanged, became the 979-trade money shredder from the table above. The code was identical. The meaning was not. If you ever port a strategy across timeframes, every bar-count parameter must be multiplied by the bar ratio, and after you have done that faithfully you will usually discover you have simply rebuilt the higher-timeframe system with extra steps, which is itself the lesson.
What about the extra opportunities? The noise floor answer
The honest counterargument deserves an honest answer: lower timeframes really do contain more swings.
Why can a strategy not harvest them?
Because a swing is only opportunity if it is larger than the noise plus the cost required to trade it. Gold moves hundreds of pips in an hour, but the path is jagged: within any 5-minute window, a meaningful share of the movement is bid-ask bounce, stop-run wicks and microstructure noise that no directional system can capture. As you zoom in, the ratio of tradeable signal to untradeable noise gets worse, not better, while the toll stays fixed. The 5-minute chart offers you twelve times as many lottery tickets and charges full price for each one.
When are lower timeframes actually legitimate?
The data does not say lower timeframes are useless. It says they cannot be your signal engine at retail costs. Three legitimate uses survived our testing and reasoning:
Entry refinement inside a higher-timeframe idea. The 1-hour system decides THAT you trade; the 5- minute chart fine-tunes WHERE you enter. Signal frequency stays at the 1-hour rate, so the cost ledger stays healthy, but each entry may gain a slightly better price.
Session-anchored trades. Opening-range strategies live on short bars by definition, because the clock, not the chart, defines the holding period. These carry their own cost discipline: one or two trades per day, not one per fluctuation.
Genuinely low-cost environments. If your all-in round trip is a tenth of retail cost, the arithmetic changes. Almost no retail trader is in this situation, and most who believe they are have not measured slippage.
A checklist before you drop down a timeframe
- Compute your true round-trip cost on the instrument: spread plus commission plus realistic slippage.
- Estimate your average winner on the new timeframe in the same units. If cost exceeds 10 to 15 percent
of it, stop here.
- Multiply every bar-count parameter by the bar ratio. Every single one: lookbacks, channels, time stops,
averages.
- Re-test on years of data, not weeks, and compare against the same strategy left on the higher
timeframe.
- Count the trades. If the trade count multiplied while total profit did not, the extra trades are donations.
Frequently asked questions
What is the best timeframe for a beginner trader?
The 1-hour chart and above. The data is blunt: lower timeframes multiply costs faster than they multiply opportunity, and beginners pay full spread on every lesson. Higher timeframes also give you time to think, which has no line item in a backtest but decides real accounts.
Is scalping profitable?
Against retail spreads, our five-year tests never found a single surviving 5-minute configuration across four different strategy families. Scalping economics require institutional-grade costs and execution. If someone sells you a scalping system, ask to see its cost assumptions first.
Do more trades make a backtest more reliable?
More trades make a backtest statistically meaningful faster, including meaningfully bad. Our 979-trade test is extremely reliable evidence of a losing configuration. Sample size validates the measurement, not the strategy. Why does my strategy work on the 1-hour but fail on the 5-minute chart?
Two compounding reasons: the per-trade cost consumes a far larger share of each smaller move, and every bar-count parameter changed meaning when the timeframe changed. Both are measurable on your own results by comparing cost totals and rescaled parameters.
Which timeframe do professional systematic traders use?
Overwhelmingly, signal generation happens on hours-to-days horizons, with faster data used only for execution quality. That split, slow signals with careful fills, is exactly what the cost arithmetic in this article predicts.
Data: 5 years of bars, 9 markets, 2021 to 2026, measured on our backtesting OneTapTrade | The Unfair Advantage | engine onetaptrade.com